How do we estimate stellar elemental abundances from stellar light? Let’s explore our workflow with images:
Target Selection
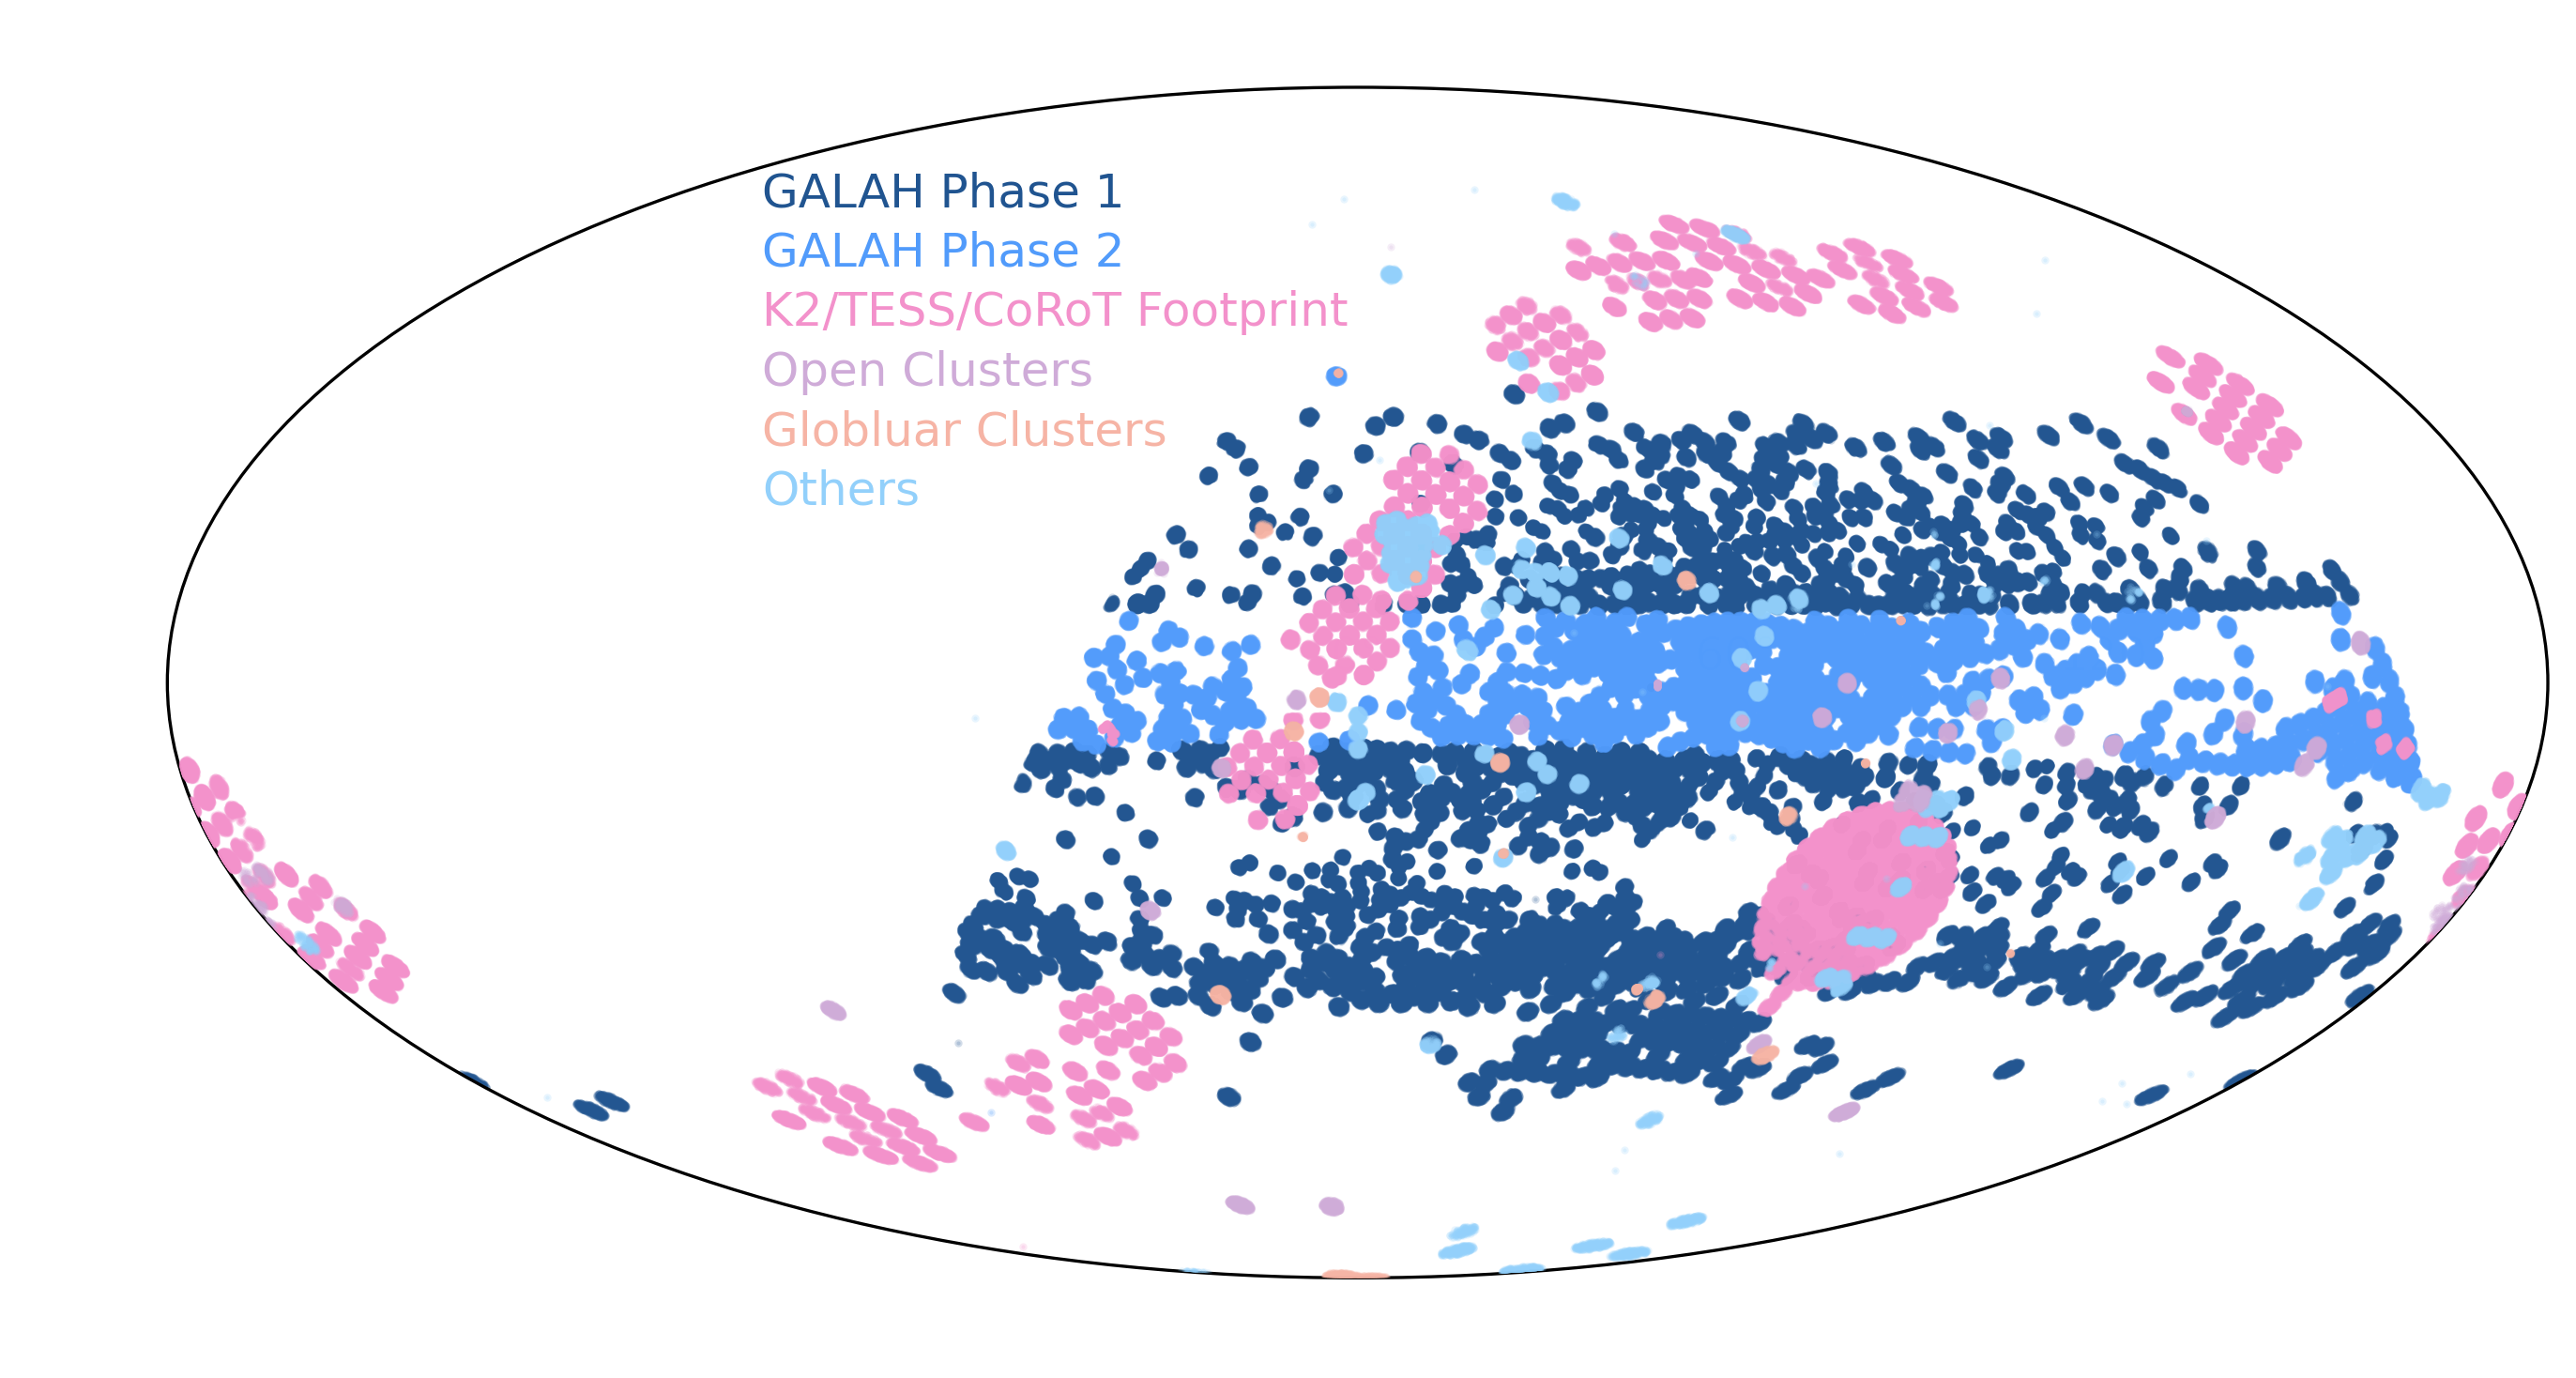
 This picture shows sky coverage of stars in GALAH DR4. Image credit: Sven Buder
GALAH has always aimed to observe 1 million stars. The Milky Way has an estimated amount of 100 billion stars. So which stars should we observe? There are several things to consider:
- How much light can our telescope — in our case the 3.9 metre diameter Anglo-Australian Telescope — capture?
- What data quality do we need to measure stellar abundances of stars? That depends highly on a lot of very technical details how much do we disperse the light to resolve absorption lines (keyword: resolution)?
- What types of stars are we most interested in and how can we select them best (before taking their spectra)?
We have thought about this a lot and decided to select stars with a magnitude 9 to 14. Magnitudes are logarithmic quantities that tell us how bright objects appear in the sky. As an example: The Sun has a magnitude of −26.74, the full moon −12.90, the brightest star Sirius has −1.47, Vega has 0, the Andromeda Galaxy has +3.44, and our 2nd closest star Proxima Centauri has +11.05.
For more details on how we actually select our stars see our target selection and observing page.
Observations
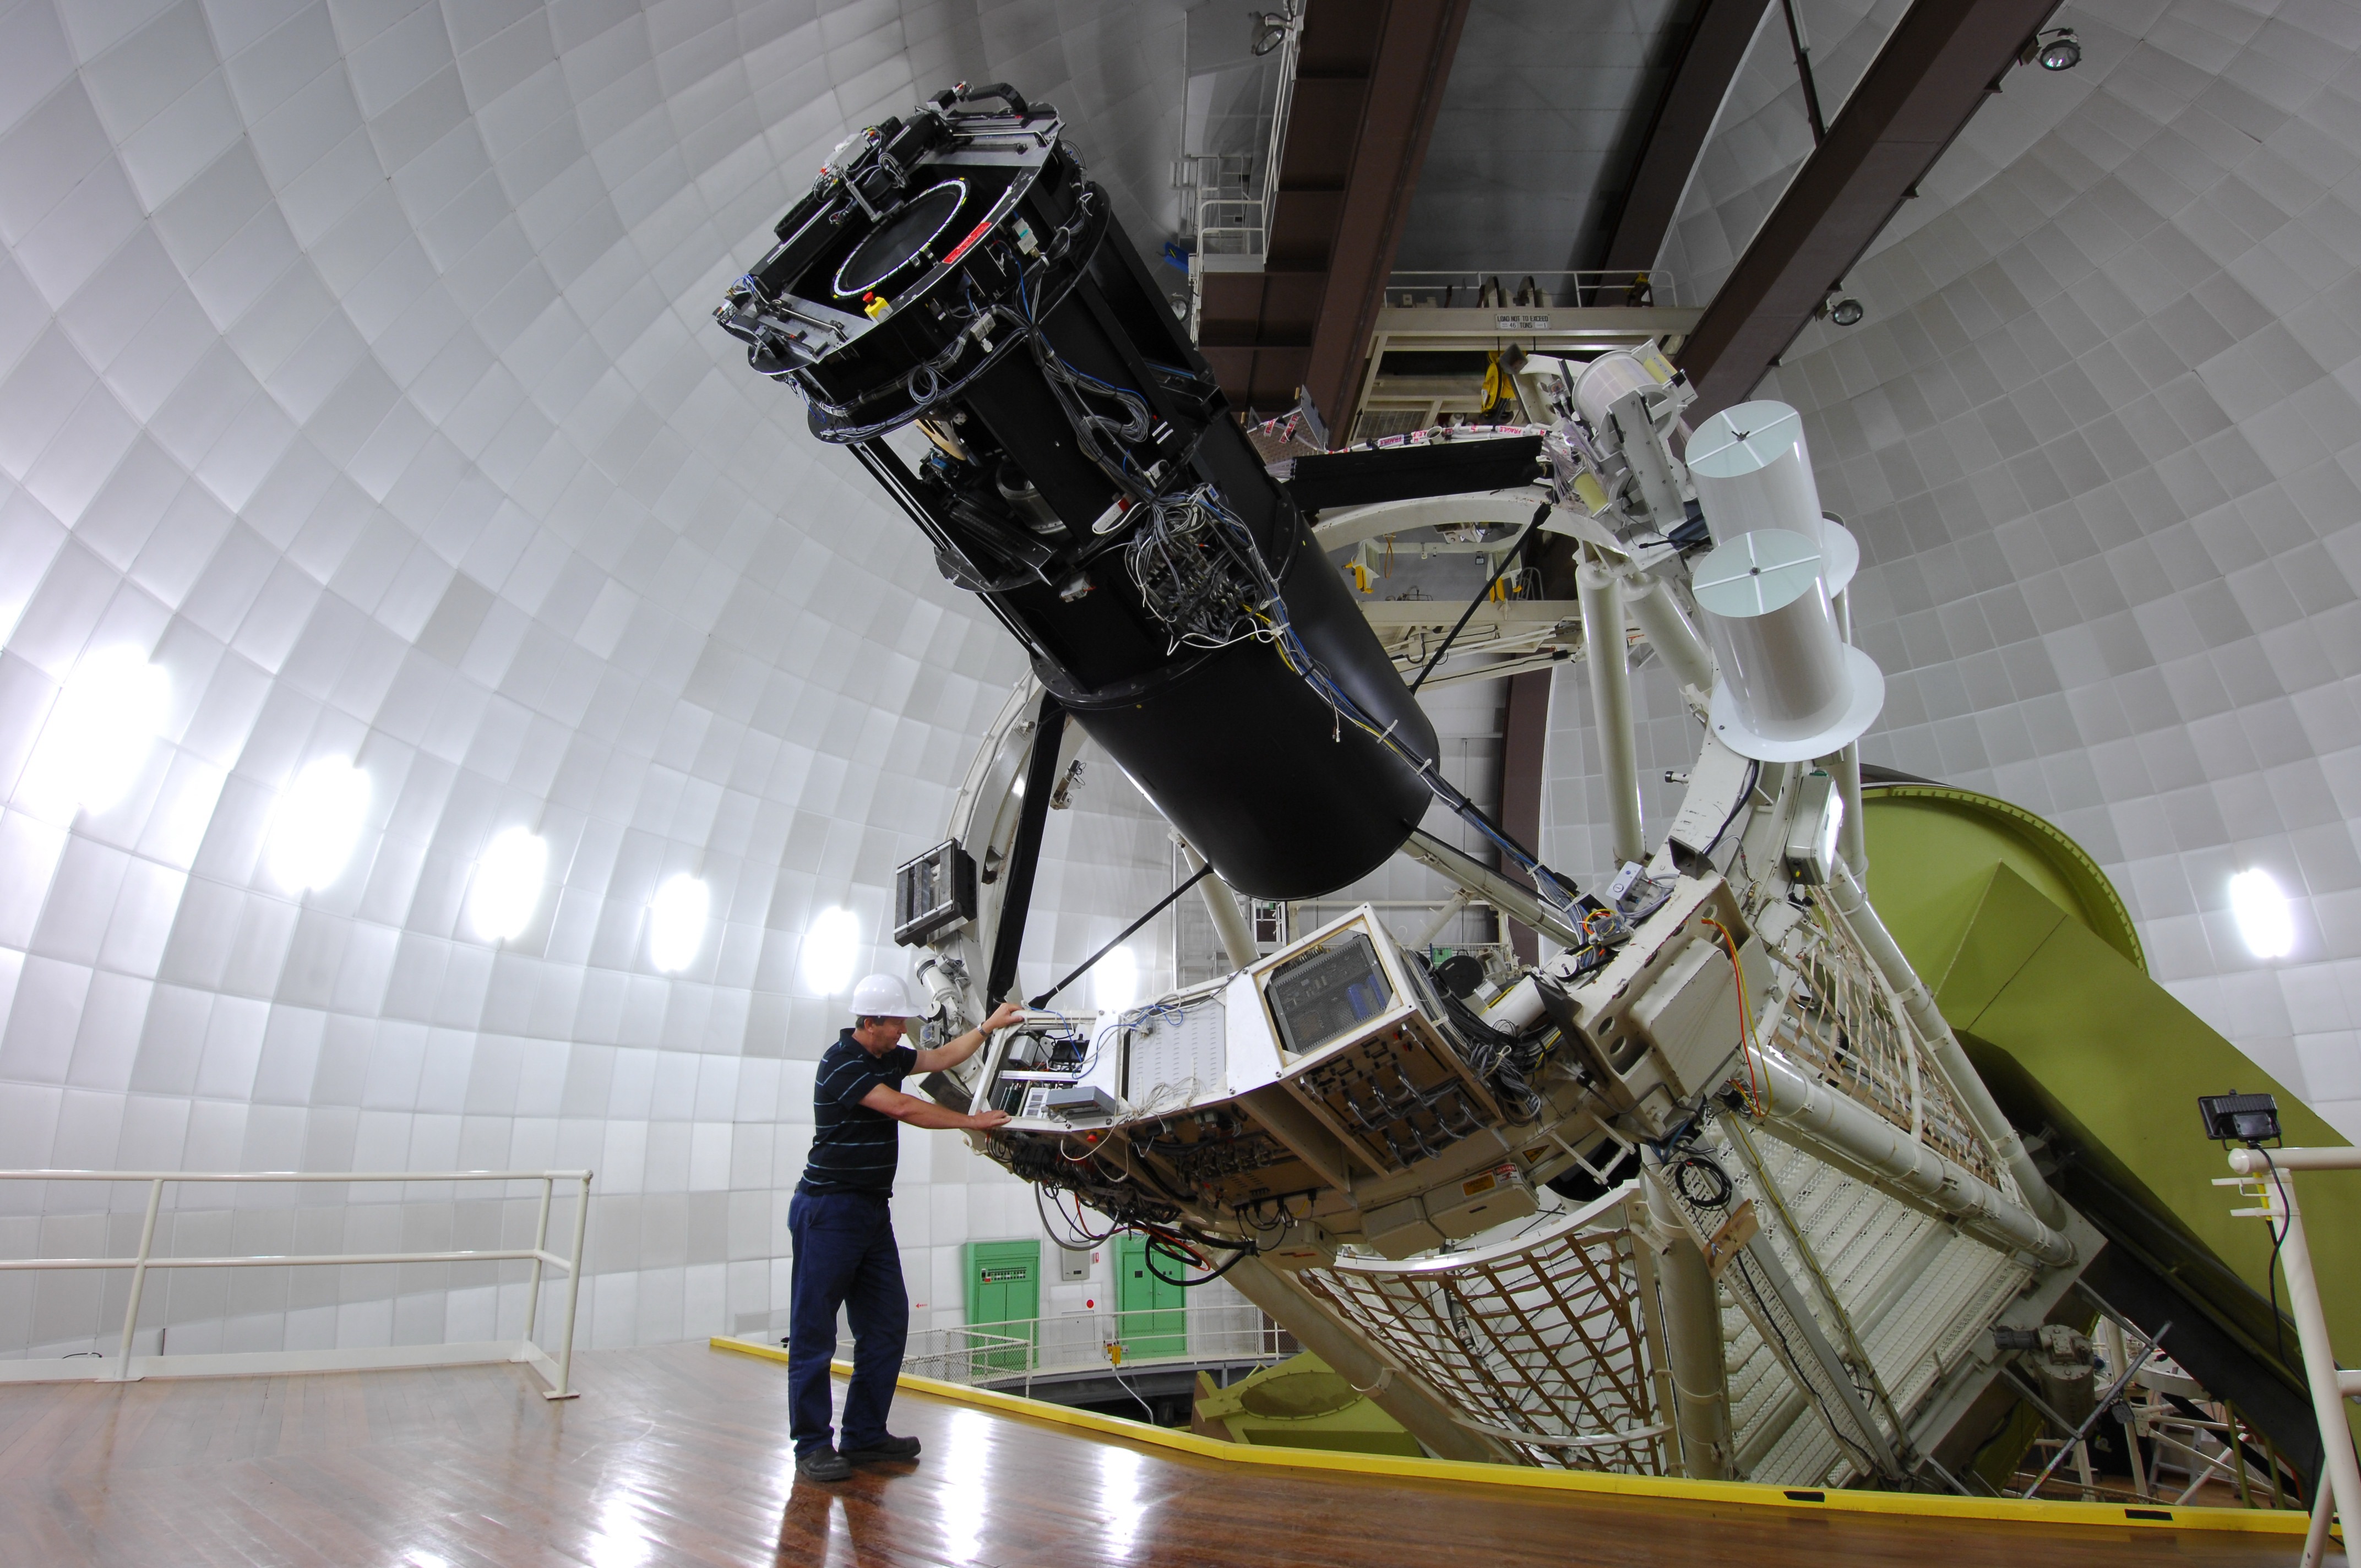
 The Anglo-Australian Telescope (with a yellow horseshoe mount) and its topend with the 2dF Positioner. Image credit: Siding Spring Observatory.
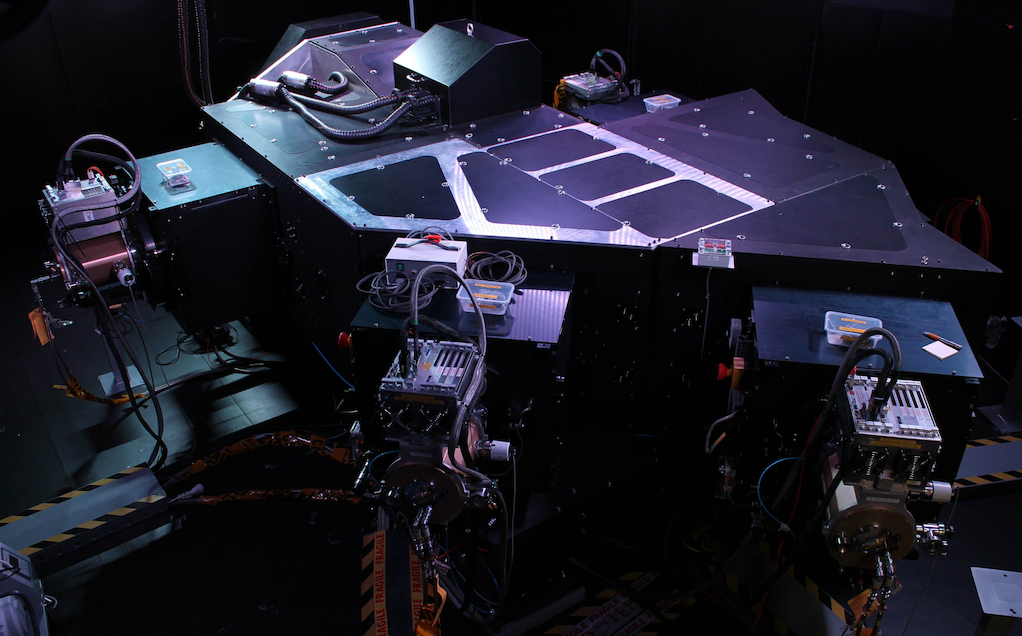
GALAH data are acquired with the 3.9-metre Anglo-Australian Telescope at Siding Spring Observatory. Up to 392 stars can be observed simultaneously using the 2dF robotic fibre positioner. The fibres run to the High Efficiency and Resolution Multi-Element Spectrograph where the light is dispersed at 𝑅∼28 000 and captured by four independent cameras. Find out more details about our observing procedure.
 The HERMES spectrograph — a black box with all the optics well covered. Image credit: Siding Spring Observatory
Reduction
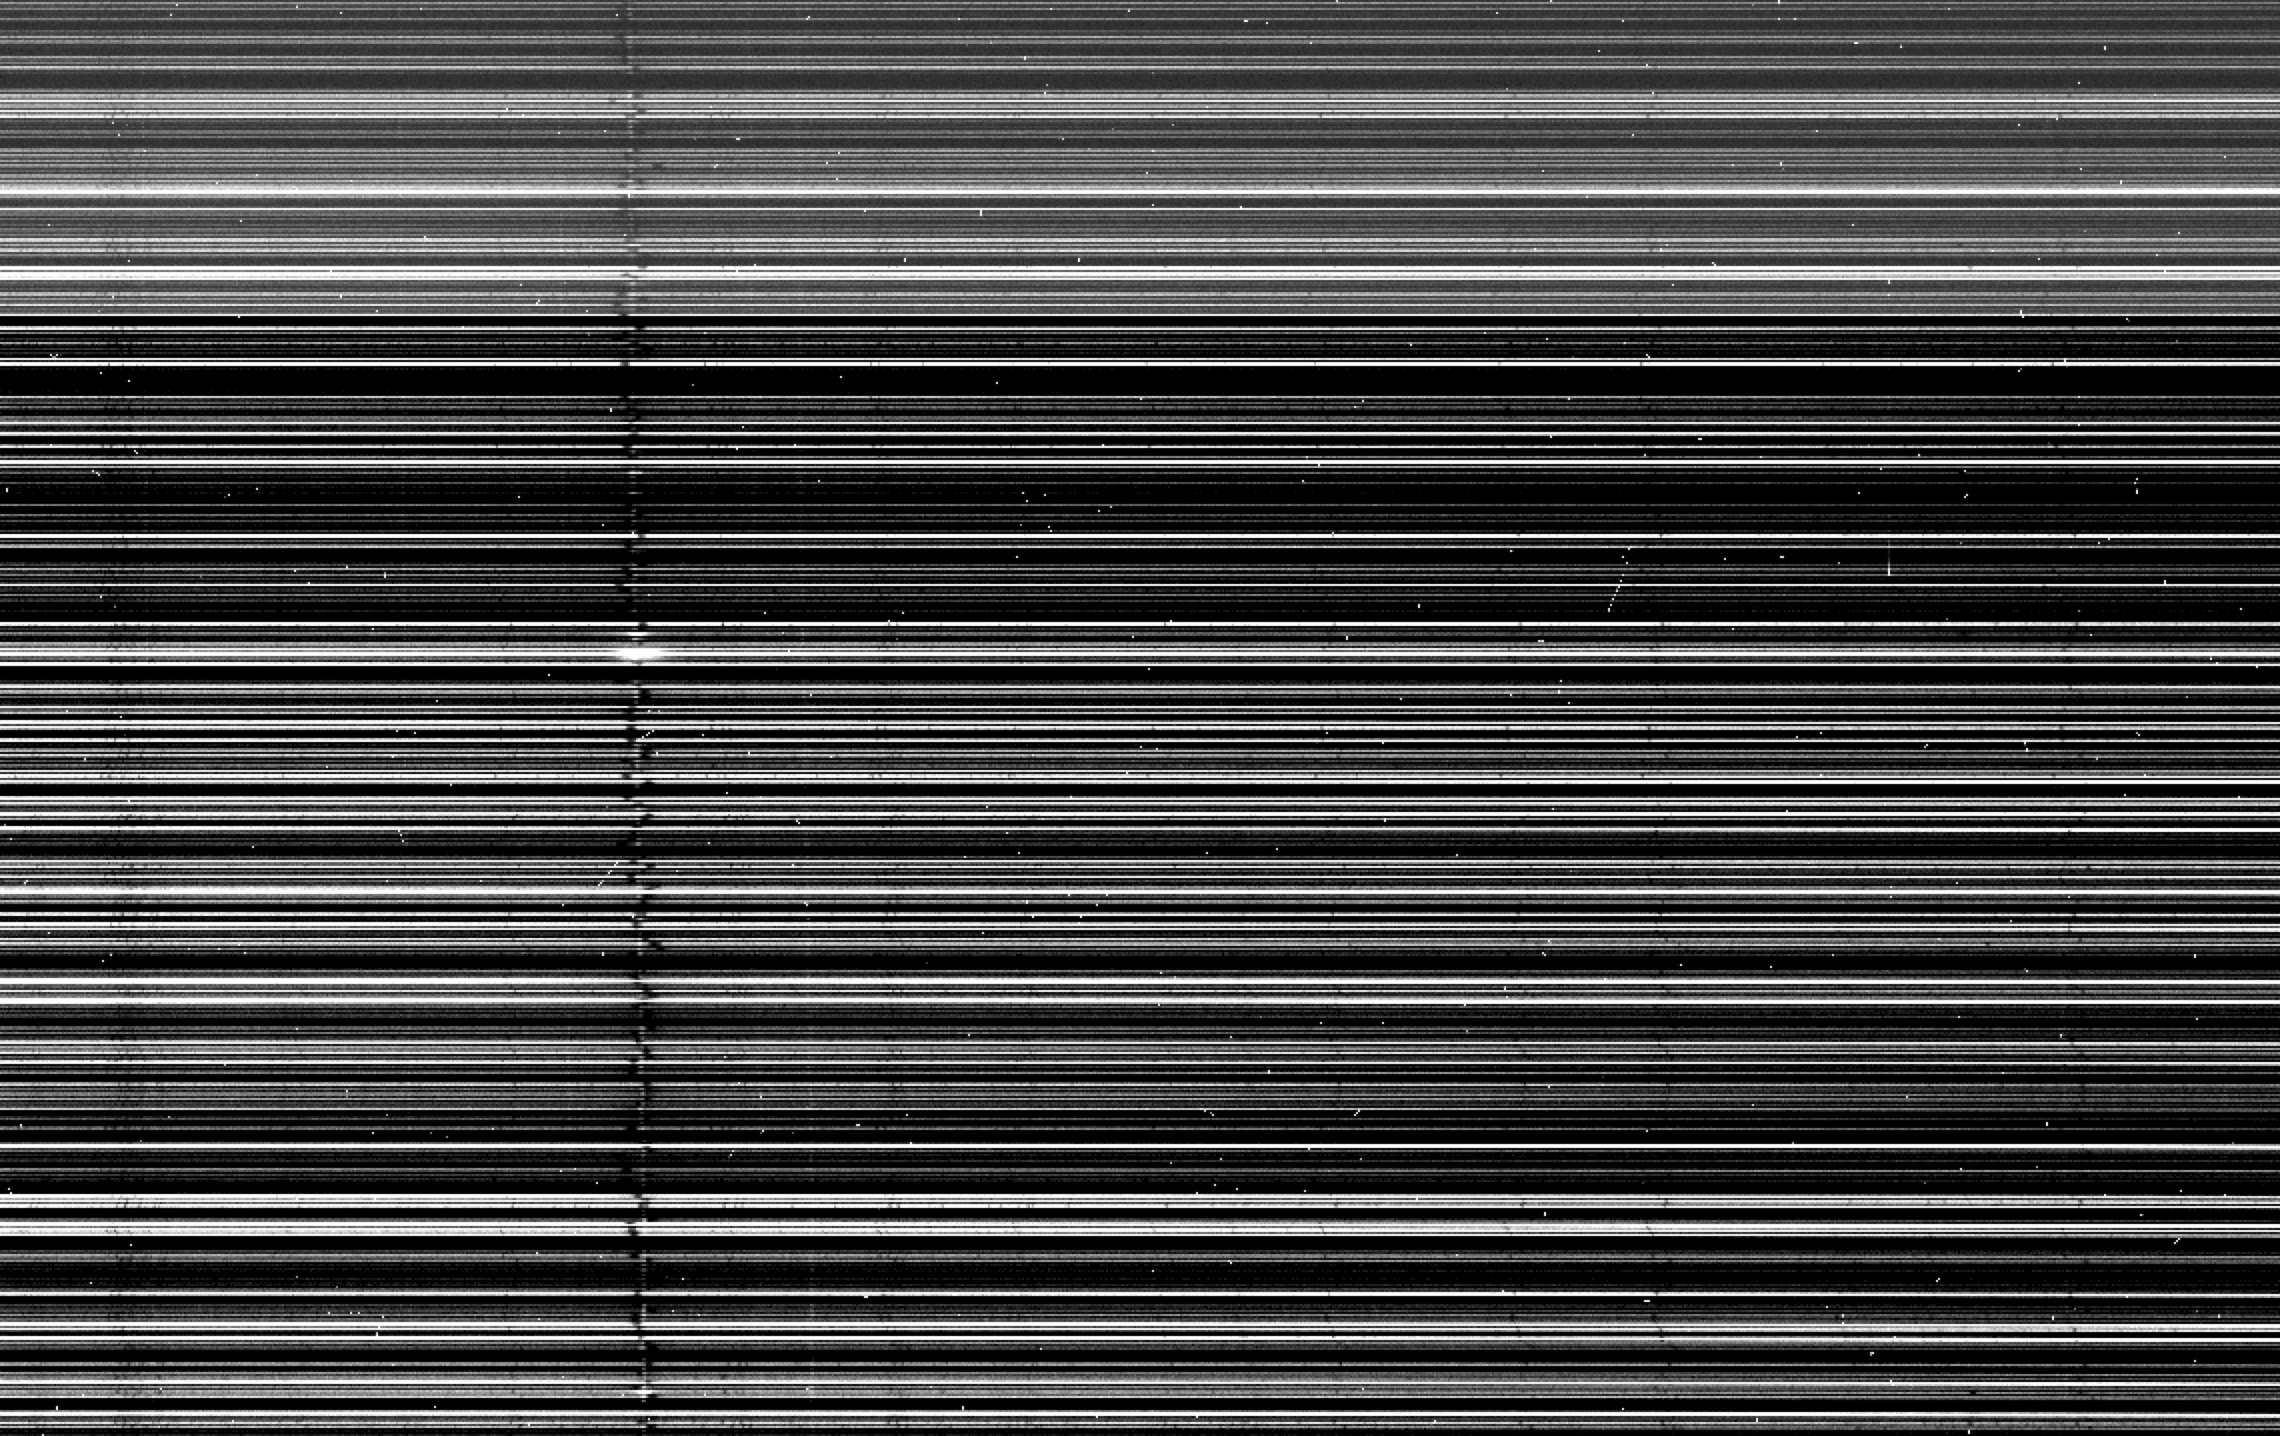
 This picture shows a part of the CCD Camera image of the 3rd HERMES detector. Spectra per star go horizontally with a greyscale indicating the number of photons/electrons counted. Absorption lines, like the strong H alpha line in the left third of each spectrum, are dark black lines and that wiggle left to right from star to star due to their motion toward or away from us. Image Credit: The GALAH Survey
For more information read our reduction pipeline paper (Kos et al. 2017) and our reduction page.
Analysis
The main data product of the GALAH survey are stellar parameters and elemental abundances for the stars we observe. Find out more about our analysis methodology.
Scientific Exploration

Find out the key results from GALAH survey data, a full list of GALAH survey publications, and publications that have used our data.